Overwhelming Support
This Pollfish poll targeted 1,000 registered Texas voters 18 years of age and up, from a diverse array of backgrounds.
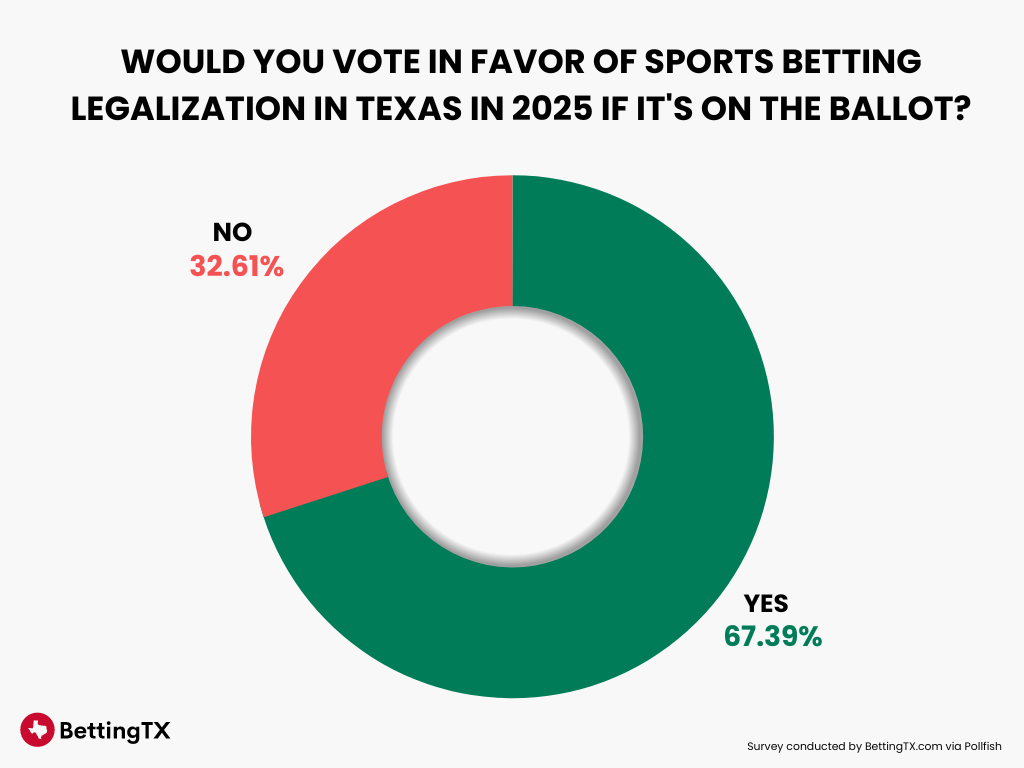
They were asked if they would vote in favor of sports betting legalization if it was on the ballot in 2025.
Overall, 67.39% of respondents stated that they would vote yes.

Age Breakdown
When you break it down by age, 69.25% of people between the ages of 18 and 24 were in favor of such a measure. The number was 74.99% for those in the 25-34 age group, and 78.65% of participants 35 to 44 years old would support a legal sports betting initiative.
The thumbs-up percentage dips down to 68.65% among Texans that are 45-54 years old, and 53.65% of respondents 55 years of age and older would vote yes on a sports betting ballot question.
Will the Question Make the Ballot in 2025?
The Texas Legislature convenes every other year, and the most recent session ended on May 29, 2023. This means that the next session will not get underway until January 14, 2025, so a sports betting question could potentially be on the ballot in November of that year.
How likely is it? During the 2023 session, the Texas House of Representatives approved HB1942 and Texas Joint House Resolution 102. These measures would have put the question of legal sports betting in Texas on the ballot in November 2023.
Shortly after the votes were recorded, Lieutenant Governor Dan Patrick announced that the bills would not be moved over to the Senate because there was insufficient support in that chamber.
What does this tell us? Though there is resistance, there is significant support for legal sports betting among lawmakers, and the voters are in favor of it. At the end of the day, there is a lot of money on the table, and that should drive the issue forward during the next session.
How Different Groups Voted
The poll measured responses from several different demographic subgroups, and we share the findings below.
Gender
|
Group |
Yes |
No |
|---|---|---|
|
Men |
74.04% |
25.96% |
|
Women |
60.85% |
39.15% |
Age
|
Group |
Yes |
No |
|---|---|---|
|
18 – 24 |
69.25% |
30.75% |
|
25 – 34 |
74.99% |
25.01% |
|
35 – 44 |
78.65% |
21.35% |
|
45 – 54 |
68.65% |
31.35% |
|
54+ |
53.65% |
46.35% |
Education level
|
Group |
Yes |
No |
|---|---|---|
|
Middle school |
57.43% |
42.57% |
|
High school |
63.37% |
36.63% |
|
Vocational/Technical college |
65.71% |
34.29% |
|
University |
71.84% |
28.16% |
|
Post-graduate |
78.09% |
21.91% |
About the poll
Pollfish, Inc. was hired by BettingTX.com to conduct this poll. All figures, unless otherwise stated, are from Pollfish, Inc. The survey consisted of 1,000 adult respondents from Texas, and the fieldwork was conducted online from August 9 to August 11, 2023.
The data has been weighted to be indicative of all Texas adults who are 18 years or older. In this context, a voter refers to an individual who answered “Yes” to the question of whether they are registered to vote in the state of Texas.


